|
 
DONGYUE GROUP(189)
Analysis:
Dongyue Group is primarily engaged in the manufacturing, distribution, and sales of refrigerants, polymer materials, organic silicon, dichloromethane, polyvinyl chloride, and caustic soda. The Group has the world’s highest production capacity for R22, which is one of the main refrigerants currently on the market and is used in household appliances. Additionally, R22 has become a key raw material for producing fluoropolymers (namely PTFE, HFP, and other downstream fluorinated chemicals) and R125. R125 and R32 are the mainstream refrigerants on the market today and are the primary components in other types of green refrigerants (such as R410a) that are replacing R22. These have been widely adopted in inverter air conditioners and other green household appliances. R134a is widely used in automotive air conditioning refrigeration and systems, while R152a is another major refrigerant product of the Group; it can also serve as a foaming agent, aerosol propellant, and cleaning agent, as well as a feedstock for producing R142b. Besides its uses as a refrigerant, temperature control medium, and aerospace propellant intermediate, R142b is also a primary raw material for producing VDF.
The Group relies on its internal supply of R22 to produce TFE, which is then used to manufacture related polymer material products, such as PTFE (a synthetic fluoropolymer with high resistance to temperature changes, excellent insulation, aging resistance, and chemical resistance; it is used as a coating material, can be further processed into high-end fine chemicals, and finds wide applications in the chemical, construction, electrical and electronic, and automotive industries) and HFP (an important organic fluorine monomer used in the production of various fine chemicals). In addition, the Group’s refrigerant division supplies R22 and R142b as feedstocks for producing a range of downstream fluoropolymer fine chemicals, including FEP, FKM, and PVDF. FEP is modified materials of of PTFE, produced by incorporating HFP into TFE, and is mainly used for wire insulation, thin-walled tubing, heat-shrinkable tubing, water pumps, valves, and plumbing. FKM, fluorine rubber, is a specialized fluorinated material which is mainly used in the fields of aerospace, automotive, machinery and petro-chemistry due to its superior mechanical property, excellent oil, chemical and heat resistance. PVDF is a fluorocarbon produced by first using R142b to make VDF and then polymerizing VDF; it is mainly used as a lithium battery cathode binder, photovoltaic backplane membrane, anti-corrosion coatings, and as a raw material for VDF.
In the first half of 2025, quota restrictions led to sharp price increases for certain key products in the Group’s refrigerant division, driving substantial performance growth in that segment. This pushed the Group’s gross margin to 29.11% (compared to 19.83% in the same period of 2024) and the overall segment profit margin to 19.08% (compared to 8.97% in the same period of 2024). Going forward, the Group will adopt a more market-oriented approach, strengthen coverage of target customers in niche segments, and build a closed-loop operating model linking “technology — sales — customers.” (I do not hold the above stock.)
Strategy:
Buy-in Price: $11.50, Target Price: $12.80, Cut Loss Price: $10.90
| 
CONCH CEMENT(914)
Analysis:
The company is primarily engaged in the production and sale of cement and commercial clinker. All of its production lines utilize advanced new dry-process cement technology, characterized by high output, low energy consumption, a high degree of automation, high labor productivity, and excellent environmental protection. The company possesses abundant high-quality limestone mineral resources in East and South China, which have low alkalinity and high calcium carbonate content, providing unique raw materials for producing high-quality low-alkali cement. The entire production process employs new dry-process rotary kiln technology with advanced equipment, achieving fully automated control from ore extraction to terminal loading, and adheres to the ISO9001 international quality certification system for quality management and monitoring. Leveraging a comprehensive transportation system of railways, highways, and waterways, the company has established a specialized production system and an extensive marketing network. For the first three quarters of 2025, the company reported revenue of 61.298 billion yuan (RMB, same below) (a year-on-year decrease of 10.06%) and net profit attributable to shareholders of 6.305 billion yuan (a year-on-year increase of 21.28%), primarily driven by cost optimization and high-margin operations. The asset-liability ratio stood at 20.59% (down 0.72 percentage points year-on-year), with monetary funds of 55.3 billion yuan and net operating cash flow of 11.1 billion yuan, indicating potential for high dividend payouts. Recently, the capacity replacement process in the cement industry has accelerated, with multiple provinces intensively issuing public notices and announcements regarding supplementary capacity replacement plans for cement enterprises within their jurisdictions, which is expected to improve the industry's competitive landscape. In 2025, the Ministry of Industry and Information Technology, together with five other departments including the Ministry of Natural Resources and the Ministry of Ecology and Environment, issued the "Work Plan for Stabilizing Growth in the Building Materials Industry (2025–2026)," listing cement capacity control as a core measure for stabilizing growth. By standardizing capacity management mechanisms to promote industry consolidation, this move is conducive to the long-term development of the sector. Leveraging its leading industry position, cost advantages, and strategic foresight, Conch Cement is poised to consolidate its leading role amid supply-side optimization in the industry. In the medium to long term, overseas expansion and industrial chain extension are expected to unlock growth potential. We believe the current valuation still has room for upside, offering investment value.
Strategy:
Buy-in Price: $23.56, Target Price: $25.90, Cut Loss Price: $22.45
|

|
GOLDWIND (2208.HK) - Resonance of Domestic and International Demand Drives High Growth Momentum in the Wind Power Sector
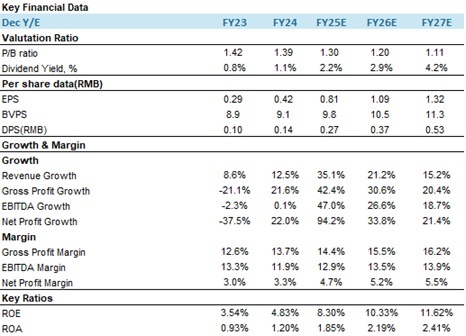
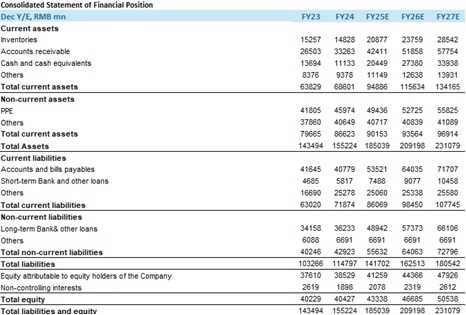
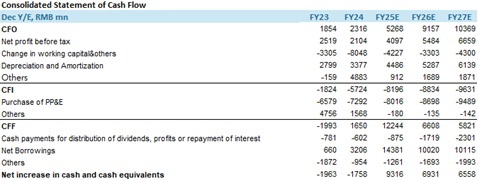
OverviewThe company is committed to building a clean energy-centric business portfolio, spanning four key sectors: Energy Development, Energy Equipment, Energy Services, and Energy Applications. In Energy Development, the company focuses on in-depth localized clean energy resource development and management. This empowers regional energy structure optimization and delivers efficient, secure energy asset management services. In Energy Equipment, adhering to stringent intelligent manufacturing quality control standards and a green supply chain management system, the company provides smarter, more reliable, and cost-effective energy equipment, making clean energy production and access readily available. In Energy Services, leveraging its professional expertise and experience across the clean energy value chain, the company offers integrated service solutions---from planning and design, engineering and construction, to energy plant operation and maintenance which ensure consistently standardized, efficient, intelligent, transparent, and flexible customized service capabilities. In Energy Applications, the company optimizes and innovates across all energy segments---generation, grid, storage, and load---actively developing zero-carbon solutions for the new-type power system. Industry AnalysisData from the National Energy Administration shows that from January to November 2025, China's total electricity consumption reached 9,460.2 billion kWh with a year-on-year increase of 5.2%. Electricity generated by industries above a designated scale amounted to 8,856.7 billion kWh. A breakdown by sector reveals the following consumption and growth: Primary Industry: 137.4 billion kWh, up 10.3%. Secondary Industry: 6,043.6 billion kWh, up 3.7%, among which Industrial consumption grew by 3.9%; consumption by high-tech and equipment manufacturing surged by 6.4%. Tertiary Industry: 1,820.4 billion kWh, up 8.5%, among which, electricity use by battery charging/swapping services and the information transmission, software & IT services sectors soared by 48.3% and 16.8%, respectively; residential consumption: 1,458.8 billion kWh, up 7.1%. Installed Power Capacity: The national total installed power generation capacity reached 3.79 billion kW with a year-on-year increase of 17.1%. Wind power capacity stood at 600 million kW, marking significant growth of 22.4%. Newly added national power generation capacity was 445.57 million kW, an increase of 128.91 million kW from the previous year, which included 82.5 million kW of new wind power capacity (up 30.76 million kW). A Historic Milestone: In Q1 2025, the combined installed capacity of wind and solar power reached 1.482 billion kW, surpassing the total installed thermal power capacity (1.45 billion kW) for the first time in history. This milestone signifies that clean energy has become the mainstay of the power system, a trend expected to continue. Wind Power Performance (Jan-Sept 2025): New Grid-Connected Capacity: 61.09 million kW total (57.59 million kW onshore; 3.5 million kW offshore). Cumulative Grid-Connected Capacity: Reached 582 million kW by end-September, a 21.3% increase. This comprises 537 million kW onshore and 44.61 million kW offshore. Power Generation & Utilization: Cumulative wind power output was 813.7 billion kWh, up 14.3%. The national average wind power utilization rate was 94.0%. Implication: The data demonstrates synchronous improvement in both the scale and efficiency of wind power, indicating a potential acceleration in the energy substitution process. Global Outlook: The Global Wind Energy Council (GWEC), in its 2025 Global Offshore Wind Report, states that most governments and developers remain committed to offshore wind, maintaining firm optimism about the medium-term global prospects. Offshore wind is projected to achieve a CAGR of 28% through 2029 and 15% through 2034. Global annual new offshore wind capacity is forecast to surpass the 30 GW milestone by 2030 and reach 50 GW by 2033. Curbing Cutthroat Competition Drives Price RecoveryIn response to national policies guiding orderly industry development, the wind power sector has actively promoted self-regulation to reverse the previous trend of low-price competition. Major players have collaboratively optimized tender rules by increasing the weighting of technical standards. Leading turbine manufacturers have proactively withdrawn from vicious price wars, shifting their focus towards value-based competition. Driven by both policy and market forces, wind turbine prices have gradually returned to rational levels. Data from International Wind Power Network shows the following average winning bid prices from January to November: Onshore Wind (including tower): RMB 2,078.17/kW; Onshore Wind (excluding tower): RMB 1,526.97/kW; Offshore Wind (including tower): RMB 3,123.49/kW; Offshore Wind (excluding tower): RMB 2,713.5/kW. The average prices for both onshore wind and offshore wind (including towers) have seen a significant recovery compared to the average price of the previous year. Document No. 136 Encourages Concurrent Pursuit of Larger-Scale and Smarter Wind TurbinesDocument No. 136 explicitly states that, in principle, all grid-connected electricity from new energy projects must enter the power market. It sets a revenue boundary through a "mechanism-based electricity price" bidding process---a difference is subsidized when the market trading price falls below this benchmark, and excess revenue is deducted when it exceeds it. This "refund or clawback" mechanism ends the previous guaranteed fixed-price scheme, forcing companies to directly face market volatility and incentivizing technological upgrades and voluntary energy storage allocation. Under this market-based competition, companies must reduce their levelized cost of energy through technological iteration to cope with electricity price pressures. The policy promotes the commercialization of technologies like larger-scale turbines and floating offshore wind power, while simultaneously accelerating the phase-out of inefficient capacity. We believe that the trend towards larger-scale wind turbines will transition from a phase of rapid growth to one of stable optimization. However, the overall trend toward upscaling remains unchanged. GOLDWIND's accelerated R&D efforts are expected to further solidify its competitive advantage in this large-scale turbine segment. Resonance of Domestic and International Demand Drives High Growth Momentum in the Wind Power SectorIn 2024, China added 79.82 million kW of new wind power capacity with a year-on-year increase of 6%, comprising 75.79 million kW of onshore and 4.04 million kW of offshore wind. The 2025 Energy Work Guidance targets national installed power generation capacity to exceed 3.6 billion kW, with over 0.2 billion kW of new renewable energy capacity. It also aims for total power generation to reach approximately 106,000 Trillion kWh and calls for continuous enhancement of inter-provincial and inter-regional transmission capabilities. The Beijing Wind Energy Declaration 2.0 proposes that to achieve the 1.5°C target, global cumulative wind power development must reach 2.7 billion kW by 2030 and exceed 4.3 billion kW by 2035. For China, it outlines that annual new wind installations during the 15th Five-Year Plan period should be no less than 0.12 billion kW, including no less than 15 million kW of new offshore wind annually. This ensures China's cumulative wind capacity reaches 1.3 billion kW by 2030, no less than 2 billion kW by 2035, and 5 billion kW by 2060. We believe that with strong policy support, domestic wind power demand is expected to maintain a high growth trajectory. National policies support companies in going global with a full industry chain encompassing "equipment + production capacity + services". According to statistics from BJX Wind Power Network, Chinese enterprises secured a cumulative 23.043 GW of international wind turbine orders in the first three quarters of 2025, with export order volume surging 100% year-on-year in the first half. Policies like Europe's Renewable Energy Acceleration Act are driving growth in offshore wind installations. As of the end of Q3 2025, GOLDWIND's total external order backlog stood at 38,861.14 MW. Its cumulative international installed capacity reached 11,214.62 MW, exceeding 3 GW in Asia (excluding China), over 2 GW each in South America and Oceania, and over 1 GW each in North America and Africa. The company's overseas external order backlog totaled 7,161.72 MW as of September 30, 2025, representing a 29.4% year-on-year increase. We are convinced that the resonance of robust domestic and international demand is creating a period of high prosperity for the wind power industry, positioning the company for sustained order growth. Both Revenue and Profit Achieved High GrowthIn the first three quarters of 2025, the company achieved high-speed growth in both revenue and profit. Revenue reached RMB 48.147 billion, representing a year-on-year increase of 34.34%. Revenue for the third quarter alone was RMB 19.61 billion, up 25.4% year-on-year. This growth was primarily driven by an increase in the scale of sales of wind turbines and components. External sales volume for the January-September period reached 18.45 GW, a significant increase of 90.01% year-on-year. Net profit attributable to shareholders was RMB 2.584 billion, marking a 44.21% year-on-year growth. The net profit for the third quarter was particularly strong at RMB 1.097 billion, surging 170.64% year-on-year, a growth rate significantly higher than the overall figure for the first nine months. The profit growth was mainly attributable to an increase in gross profit and gains from changes in fair value, despite a decrease in investment income. Gross Margin Declined While Net Profit Margin Improved, Showcasing Effective Cost ControlA divergence was observed between gross margin and net profit margin. The gross margin for the first three quarters of 2025 was 14.39%, down 2.04 percentage points year-on-year. However, the net profit margin attributable to shareholders improved to 5.37%, up 0.37 percentage points year-on-year. This improvement was mainly due to a decline in the period expense ratio, with financial expenses decreasing by 47.3% year-on-year, demonstrating the effectiveness of the company's expense control measures. Operating Cash Flow Significantly Improved, Indicating Enhanced Operational EfficiencyNet cash outflow from operating activities in the first three quarters of 2025 was RMB 633 million, a substantial 90.27% improvement compared to the net outflow of RMB 6.507 billion in the same period last year. This improvement was primarily driven by a year-on-year increase in cash received from selling goods and providing services. Operational efficiency showed signs of improvement, with inventory turnover days decreasing by 28% to 119.47 days and accounts receivable turnover days decreasing by 13% to 195.07 days. The asset-liability ratio stood at 73.11%, remaining relatively stable around the 70% level for multiple years. Company valuationAs a global leader in wind power, we believe that with the support of relevant policies, wind power demand will grow steadily, overseas orders are expected to increase gradually, and the company's future growth exhibits strong certainty, with robust development prospects.We forecast the company's revenue for 2025-2027 to be RMB 76.34 billion, RMB 92.537 billion, and RMB 106.622 billion, respectively, with EPS of RMB 0.81, RMB 1.09, and RMB 1.32. We employ the Discounted Cash Flow (DCF) method for absolute valuation.Key assumptions in the DCF analysis:WACC: Calculated using the formula WACC = Kd * Wd (1-T) + Ke * (1-Wd), resulting in 10.23%.Discounting Period: From 2025 to 2031.Perpetual Growth Rate: 2%.With a WACC of 10.23% and a perpetual growth rate of 2%, the company's fair value per share is estimated at HKD 19.21. We initiate coverage with a "Buy" rating.Under the scenario where WACC ranges from 9.21% to 11.25% and the perpetual growth rate ranges from 1.8% to 2.2%, the fair value per share falls within the range of HKD 14.72 to HKD 25.28. 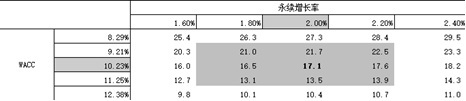
Risk factors1) Intensifying industry competition may lead to price wars and margin compression;
2) Policy adjustments could affect the pace of industry development;
3) Fluctuations in raw material prices may impact cost control;
4) Geopolitical risks could hinder overseas business expansion;
5) Uncertainties arising from changes in technological roadmaps. Financial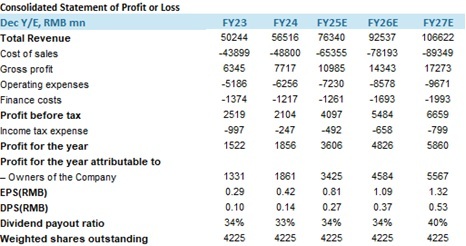
(Current Price as of: 15 Jan 2026)
Exchange rate: HKD/RMB = 0.89
Source: PSHK Est. Download PDF version...
| Recommendation on 21-1-2026 | | Recommendation | Buy | | Price on Recommendation Date | $ 14.210 | | Suggested purchase price | N/A | | Target Price | $ 19.210 |
| |
|
|
|
|
| Stock Code |
H share
Price |
A share
Price |
H share
discount |
| | | |
|
Information contained herein is based on sources that Phillip Securities (Hong Kong) Limited and/or its affiliates ( the “Group”) believe to be accurate. The Group does not bear responsibility for any loss occasioned by reliance placed upon the contents hereof. The Group (or its employees) may have interests in relevant investment products. For details of different products’ risks, please view the Risk Disclosures Statement on http://www.phillip.com.hk.
If you DO NOT wish to receive further marketing emails from us, please click HERE to opt-out.
版權所有, 翻印必究。
Copyright(C) 2026 Phillip Securities (HK) Ltd. All Rights Reserved.
|